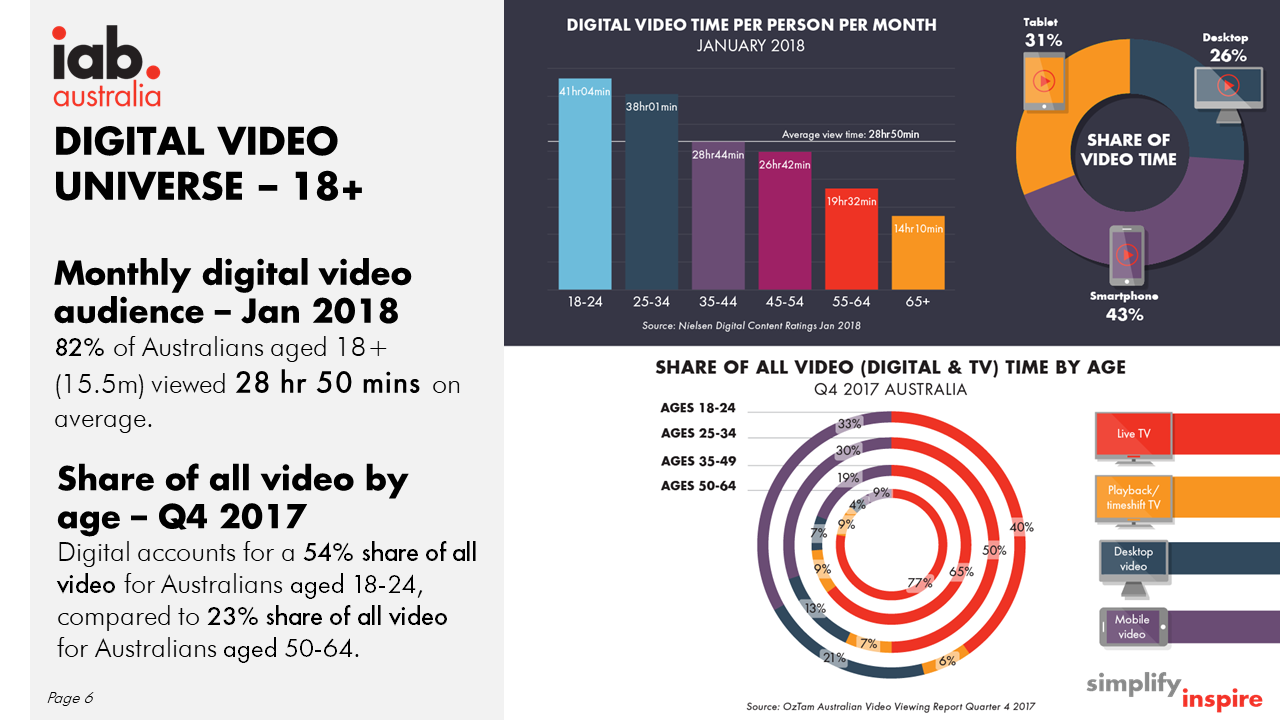
An infographic summary of Australian digital video consumption trends (18+) in January 2018 and share of all video in Q4 2017.
On average, 82% of Australians aged 18+ (15.5m) are viewing 28 hr 50 mins of digital video content per month. Download the infographic to see the share of digital video time between mobile, tablet and desktop devices for January 2018, and the share of all video by age for Q4 2017.